• There are no suggestions because the search field is empty.
Progyny Outcomes

Proven impact across every chapter of care

Progyny covers the full arc of family building and women's health from fertility through menopause, with superior outcomes at every stage.

For members, it means feeling supported through an often emotional journey, with a clearer and more confident path to the care they need. For employers, it means stronger outcomes and lower total costs. Build the model right, and the results show up on both sides.

happy-family-of-three-holding-young-baby
CARE THAT STARTS EARLY
~ 0 %

of members achieve their goals without the need for fertility treatment

HEALTHIER PREGNANCIES & BABIES
0 %
reduction in high-risk maternity spend
SMOOTHER TRANSITIONS
0 %
of parents report less stress
MORE SUPPORTED EMPLOYEES
0 %
of members in midlife report productivity and focus have improved at work

Source: Progyny BoB 2026

The only family building and women’s health solution that works this way

Progyny is proud to be the only solution to independently validate all fertility clinical outcomes for all member data—by Milliman—rather than just for a select subset of members or sample of select outcomes.

Proven impact

Our Annual Fertility Outcomes Report demonstrates that Progyny significantly exceeds national benchmarks on every key clinical measure of fertility success. Progyny’s members conceive faster, experience significantly fewer miscarriages, and have healthier pregnancies and babies, as compared to national averages.

More healthy pregnancies

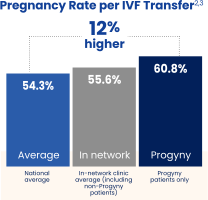
Pregnancy rate per IVF transfer measures the percentage of IVF treatments that result in a clinical pregnancy. Progyny’s pregnancy rate per IVF transfer is 12% higher than the national average and its miscarriage rate is 21% lower.

 Progyny’s pregnancy rate per IVF transfer is 12% higher than the national average and its miscarriage rate is 21% lower.


More healthy babies

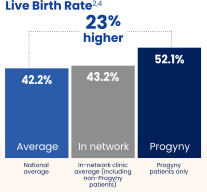
The goal for anyone requiring fertility care is a healthy baby. Live birth rate — the percentage of embryo transfers that result in a live birth — is the leading indicator for a solution’s likelihood to deliver on this goal. Progyny members’ live birth rate is 23% higher than the national average.

Progyny members’ live birth rate is 23% higher than the national average.


Fewer treatments

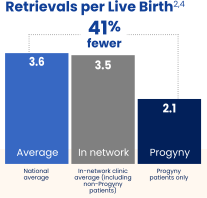
Retrievals per live birth measures how much treatment is needed to achieve a successful outcome. Progyny’s model leads to 41% fewer retrievals per live birth than the national average.

Progyny’s model leads to 41% fewer retrievals per live birth than the national average.


Fewer high-risk pregnancies

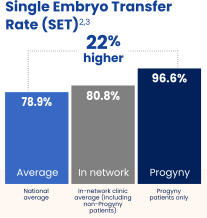
Singleton pregnancies are most likely to deliver at term while multiple pregnancies (twins, triplets) carry a significantly higher risk for both miscarriage and preterm birth — making single births the surest path to healthy babies. SET rate is the percentage of IVF transfers where a single embryo transfer occurred. Progyny’s SET rate is 22% higher than the national average and its IVF multiples rate is 61% lower than the national average.

Progyny’s SET rate is 22% higher than the national average and its IVF multiples rate is 61% lower than the national average.


1. Progyny BoB 2026 | 2. Progyny represents Progyny in-network provider clinic averages for Progyny members based on the 12-month period ended December 31, 2023. For each Progyny outcome presented, the p-value when compared to the national average is <0.0001. | 3. Calculated based on the Society for Assisted Reproductive Technology, or SART, 2021 National Summary Report, finalized in 2024. | 4. Calculated based on CDC, 2022 National Summary and Clinic Data Sets, published in 2024.

Industry-leading results for members and employers

Progyny independently validates fertility outcomes across its full member population, providing a transparent view of performance at scale.

Using full-population data gives clients a more complete and transparent view of performance over time.

massmutual
heb
st-jule-childrens-research
microsoft
charter-communications
google
the-boston-company
nike
2020-EB-HCA-Healthcare-FC-resized
genentech
metro-nashville-public-school
99 %
client retention
600 +
clients across 45+ industries
7.2 M
lives covered
+ 81
NPS

Go deeper on Progyny's proven outcomes

Check out these additional resources that show how our model is designed to deliver best-in-class outcomes.
every-outcomes-count-report-screenshot

Annual fertility outcomes report

Explore our industry-leading results
Blog-image-From-preconception-to-menopause-How-proactive-womens-health-management-lowers-costs-for-employers

Client spotlight: CHG Healthcare

Learn why CHG Healthcare implemented Progyny
Asian-family-of-four-smiling-on-the-couch

The true cost of fertility care

Hear from the experts in this webinar

pregnant-woman-at-provider-office-cradling-stomach-1500px

Right care, right time research brief

See how benefits design shapes outcomes

Behind every outcomes stat is a person

These are the moments the numbers alone can't fully capture: a diagnosis, a due date, a smooth return to work, and a clearer path through midlife. 

“Life-changing. Progyny is amazing. This is where your life can change, your childbearing, family-creating dreams can come true. It starts with them."
Progyny member
“My PCA was cordial and professional, explaining the program choices well. We have a follow up appointment scheduled and I look forward to meeting with a provider that has expertise in Menopause.”
Progyny member
"My pregnancy and postpartum coach has been my most valuable asset in my third trimester, and I'm so thrilled that I have access to her as I become a parent for the first time."
Progyny member
"Progyny has truly been a life-changing benefit for our family. It made an incredibly difficult and emotional fertility journey much more manageable by streamlining the process with our fertility clinic and specialty pharmacy and helping remove so much of the financial and logistical stress."
Progyny member

Let’s talk

See what outcomes like these could look like across your workforce.